Why Most SEO Reports Fail
I’ve reviewed hundreds of SEO reports over the years. Most of them share the same problem: they’re packed with data but empty on meaning.
A typical failing report looks like this:
- “Rankings improved for 47 keywords”
- “Domain Authority increased from 34 to 36”
- “We built 23 new backlinks this month”
The executive reading this has one question: So what?
The problem isn’t the data—it’s the disconnect from business results.
Here’s what actually happened when I restructured a client’s monthly SEO report:
Before: 12-page report with 50+ metrics. Result: report ignored, SEO budget questioned.
After: 2-page report with 8 KPIs tied to revenue. Result: budget increased 40%, C-suite actually reads it.
Before
The typical over-stuffed report
Pages
Metrics reported
Budget questionedAfter
Focused, revenue-tied report
Pages
KPIs tied to revenue
Budget +40%The difference? Fewer metrics, more meaning.
The SEO KPI Framework: 4 Categories
Not all SEO metrics are created equal. I organize them into a funnel that mirrors the customer journey:
| Stage | What It Measures | Example KPIs |
|---|---|---|
| Visibility | Can people find you? | Impressions, Rankings, Search Visibility |
| Traffic | Are they clicking? | Organic Sessions, CTR, Non-Branded Traffic |
| Engagement | Do they stay? | Engagement Rate, Pages/Session |
| Revenue | Do they convert? | Organic Conversions, Revenue, ROI |
The key insight: Problems at the top cascade down. Low visibility = low traffic = low revenue. Your KPIs should help you diagnose where in the funnel you’re losing.
Visibility KPIs (Top of Funnel)
These metrics tell you whether your content is showing up in search results.
1. Search Impressions
What it is: The number of times your pages appeared in search results (regardless of clicks).
Why it matters: Impressions are your SEO reach. Growing impressions means Google is showing you for more queries or more frequently.
Where to track: Google Search Console → Performance → Total Impressions
What to watch for:
- Sudden drops = potential indexing issues or algorithm update impact
- Steady growth = content strategy working
- Flat line = you’re not expanding keyword coverage
2. Average Position / Keyword Rankings
What it is: Where your pages rank for target keywords.
Why it matters: Position 1 gets ~27% of clicks. Position 10 gets ~2.5%. The difference between page 1 and page 2 is the difference between traffic and obscurity.
How to track it right:
Don’t track 500 keywords. Track these groups:
- Money keywords (10-20): High-intent terms that drive conversions
- Traffic drivers (20-30): High-volume terms that bring visitors
- Brand terms (5-10): Your brand name variations
Pro tip: Track average position movement, not just current position. Moving from position 18 to 9 is huge progress, even though you’re not on page 1 yet.
3. Search Visibility Score
What it is: A weighted score showing your overall SERP presence across tracked keywords.
Why it matters: Single keyword rankings fluctuate daily. Visibility score smooths out the noise and shows true trends.
Where to get it: Ahrefs, SEMrush, or Sistrix calculate this automatically. If using free tools, create your own by weighting rankings (position 1 = 100 points, position 2 = 90, etc.).
| KPI | What It Tells You | Red Flag |
|---|---|---|
| Impressions | Your search reach | >20% drop week-over-week |
| Avg. Position | Ranking competitiveness | Money keywords falling off page 1 |
| Visibility Score | Overall SERP presence | Downward trend over 30 days |
Traffic KPIs (Middle of Funnel)
Visibility means nothing if people aren’t clicking. These KPIs measure actual visits.
4. Organic Sessions
What it is: The number of visits from organic search.
Why it matters: This is the core SEO metric. Everything else supports this number.
Where to track: GA4 → Reports → Acquisition → Traffic Acquisition → Filter by “Organic Search”
Segment it properly:
- By landing page (which content drives traffic?)
- By device (mobile vs desktop trends)
- By country (if you target multiple markets)
5. Organic Click-Through Rate (CTR)
What it is: Clicks ÷ Impressions. The percentage of people who see your listing and click.
Why it matters: Low CTR with high impressions = your titles and descriptions aren’t compelling. This is fixable without building a single link.
Benchmarks by position (based on CTR research):
| Position | Expected CTR |
|---|---|
| 1 | 25-35% |
| 2 | 15-18% |
| 3 | 10-12% |
| 4-5 | 6-8% |
| 6-10 | 2-5% |
What I’ve seen work: If your CTR is below benchmark for your position, test new title tags. I’ve seen CTR improvements of 30-50% just from better titles—no ranking change needed.
6. Non-Branded vs Branded Traffic
What it is: Traffic from searches that include your brand name vs. searches that don’t.
Why it matters: This is the metric that separates real SEO growth from brand awareness spillover.
If your “organic traffic” is growing but it’s 80% branded searches, your SEO isn’t working—your marketing is. Non-branded organic traffic is the true measure of SEO success.
Example interpretation:
- Total organic: +25% YoY ✓
- Branded organic: +40% YoY
- Non-branded organic: +8% YoY ← This is your real SEO growth
Engagement KPIs
Traffic is great, but if visitors bounce immediately, something’s wrong.
7. Engagement Rate (GA4)
What it is: The percentage of sessions that were “engaged” (lasted >10 seconds, had a conversion event, or had 2+ page views).
Why it matters: This replaced bounce rate in GA4 and is more meaningful. It tells you if organic visitors are actually interested in your content.
Benchmark: 50-60% engagement rate is solid for blog content. Product pages should aim higher (65%+).
8. Pages per Session
What it is: Average number of pages viewed per visit.
Why it matters: More pages = more engagement = higher chance of conversion. Also indicates good internal linking.
Target: 1.8-2.5 for informational content, 3+ for e-commerce.
9. Average Session Duration
What it is: How long visitors stay.
Why it matters: Time on site correlates with content quality and user satisfaction. Google likely uses engagement signals in rankings.
Warning: Don’t obsess over this metric in isolation. A 30-second visit might be perfect if the user found their answer quickly.
| Content Type | Good Engagement Rate | Good Avg. Duration |
|---|---|---|
| Blog posts | 55%+ | 2-4 min |
| Product pages | 65%+ | 1-2 min |
| Landing pages | 60%+ | 1-3 min |
Blog Posts
Engagement Rate
2 – 4 min avg.Product Pages
Engagement Rate
1 – 2 min avg.Landing Pages
Engagement Rate
1 – 3 min avg.Conversion & Revenue KPIs (Bottom of Funnel)
This is where SEO connects to business results. These KPIs justify your budget.
10. Organic Conversions
What it is: Goal completions or transactions from organic traffic.
Why it matters: Ultimately, SEO exists to drive business outcomes. Track conversions, not just traffic.
Track both:
- Macro conversions: purchases, demo requests, sign-ups
- Micro conversions: newsletter subscriptions, PDF downloads, video views
11. Organic Revenue / Lead Value
What it is: Actual revenue attributed to organic search, or the calculated value of leads generated.
For e-commerce: Direct revenue tracking in GA4.
For lead gen: Assign values to conversions. If 10% of demo requests become customers worth $10,000, each demo request = $1,000 value.
12. SEO ROI
What it is: (Organic Revenue – SEO Investment) ÷ SEO Investment × 100
Why it matters: This is the number that gets budgets approved.
Example calculation:
Monthly organic revenue: $50,000
Monthly SEO cost (tools + team + content): $8,000
SEO ROI: ($50,000 - $8,000) ÷ $8,000 × 100 = 525%
SEO ROI Calculation
A common mistake I see: Calculating ROI on a single month. SEO compounds. A page ranking today might generate revenue for years. Use a 6-12 month rolling window for accurate ROI.
Technical SEO KPIs (Health Metrics)
These aren’t growth metrics—they’re health checks. Think of them like vital signs.
| Metric | Where to Find It | Red Flag |
|---|---|---|
| Indexed Pages | GSC → Pages | Sudden drops or stuck growth |
| Core Web Vitals | GSC → Core Web Vitals | >25% URLs “Poor” |
| Crawl Errors | GSC → Pages → Not Indexed | 4xx/5xx errors increasing |
| Mobile Usability | GSC → Mobile Usability | Any issues flagged |
Monthly technical SEO checklist:
- ☐ Check indexed pages count (compare to previous month)
- ☐ Review Core Web Vitals scores
- ☐ Scan for new crawl errors
- ☐ Verify sitemap is up to date
- ☐ Check robots.txt for issues
- ☐ Review page speed for top 10 landing pages
How to Build an SEO Report That Gets Read
The best SEO report isn’t the most detailed one—it’s the one that gets read and acted upon.
Executive Summary (1 paragraph)
“Organic traffic grew 18% MoM, driven by new content in the [category] cluster. Organic revenue hit $47K, up from $41K. Main opportunity: improving CTR on product pages (currently 2.1% vs 4% benchmark).”
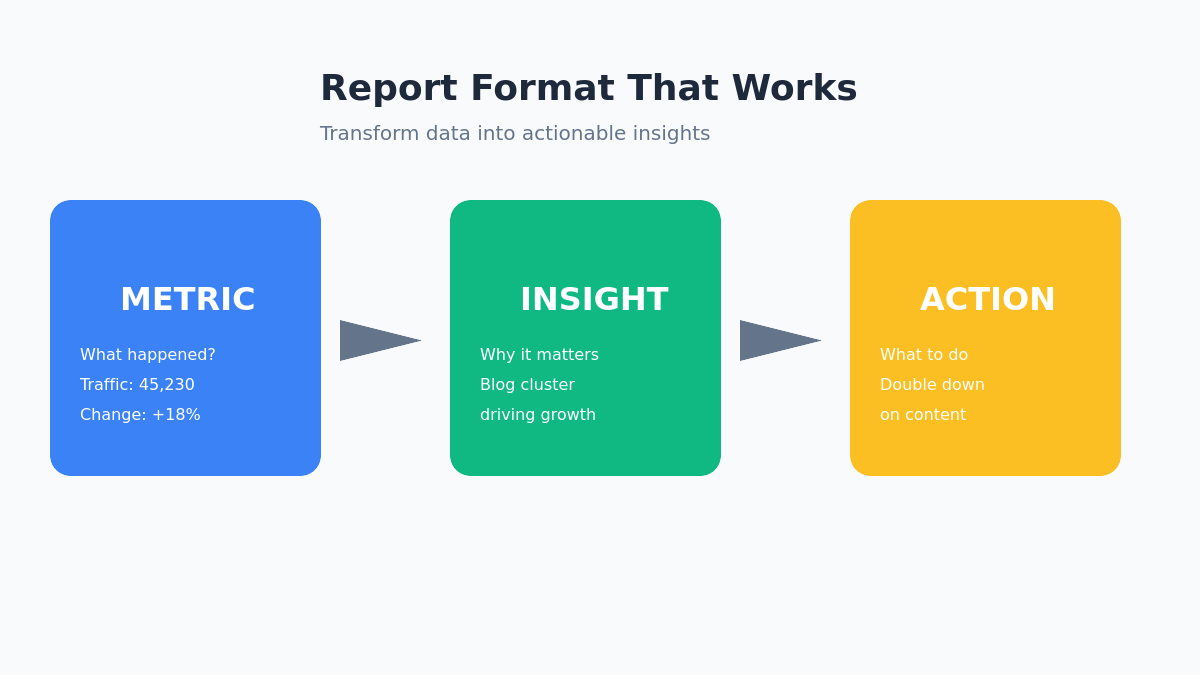
Metric → Insight → Action Format
Don’t just report numbers. Follow this structure:
| Metric | This Month | Change | Insight | Action |
|---|---|---|---|---|
| Organic Sessions | 45,230 | +18% | New blog cluster driving growth | Double down on similar content |
| Avg. CTR | 2.1% | -0.3% | Product page titles underperforming | A/B test new title tags |
| Organic Revenue | $47,000 | +15% | Conversion rate stable | Focus on traffic growth |
1. Metric
State the number and its change.
Example: “Organic sessions: 45,230 (+18% MoM)”
2. Insight
Explain what it means in business terms.
Example: “New blog cluster driving growth in [category]”
3. Action
Recommend a specific next step.
Example: “Double down: publish 4 more posts in this cluster”
Visualization Tips
- Use line charts for trends (traffic, impressions over time)
- Use bar charts for comparisons (this month vs last)
- Use tables for KPI snapshots
- Keep it to 3-5 visualizations max
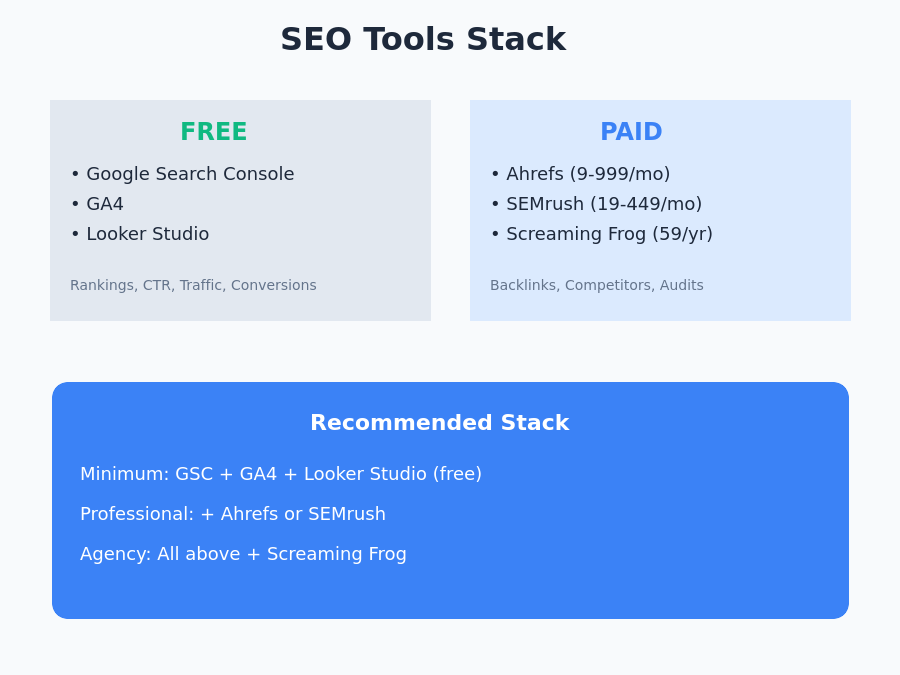
SEO Reporting Tools Stack
Free Tools
| Tool | Best For |
|---|---|
| Google Search Console | Rankings, impressions, CTR, technical issues |
| GA4 | Traffic, engagement, conversions |
| Looker Studio | Custom dashboards combining GSC + GA4 |
Paid Tools
| Tool | Best For | Price Range |
|---|---|---|
| Ahrefs | Backlinks, keyword research, visibility score | $99-999/mo |
| SEMrush | All-in-one, competitor analysis | $119-449/mo |
| Screaming Frog | Technical audits | Free (500 URLs) / $259/yr |
My recommended stack:
- Minimum: GSC + GA4 + Looker Studio (free)
- Professional: Add Ahrefs or SEMrush for competitive insights
- Agency: All above + Screaming Frog + client-specific tools
- Google Search Console
Rankings, impressions, CTR - GA4
Traffic, engagement, conversions - Looker Studio
Custom dashboards
- Everything in Free
- Ahrefs or SEMrush
Backlinks, keyword research, competitor analysis
- Everything in Pro
- Screaming Frog
Technical audits at scale - Client-specific tools
White-label reporting
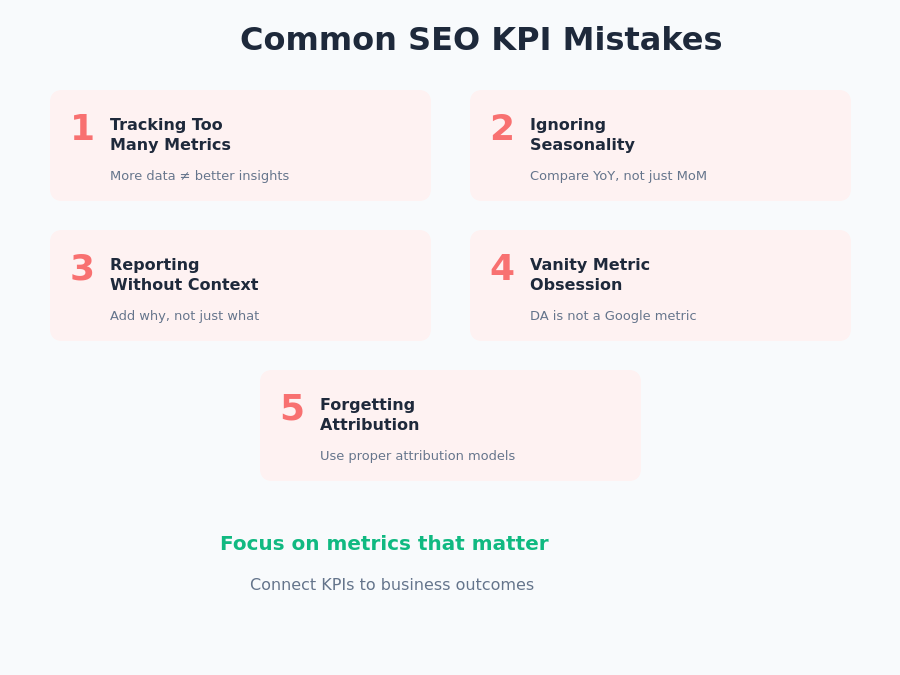
Common SEO KPI Mistakes
1. Tracking too many metrics
More data ≠ better insights. If you can’t explain why a metric matters to the business, drop it.
2. Ignoring seasonality
Always compare year-over-year, not just month-over-month. December traffic dips aren’t SEO failures—they’re holiday patterns.
3. Reporting without context
“Traffic dropped 10%” means nothing without context. “Traffic dropped 10% following a Google algorithm update that affected 40% of sites in our space” is useful.
4. Vanity metric obsession
Domain Authority is not an SEO KPI. It’s a third-party score that Google doesn’t use. Same with “number of backlinks” without quality context.
5. Forgetting attribution windows
SEO influence doesn’t end at first click. Someone might find you via organic search, leave, and convert via email later. Use proper attribution models.
Tracking Too Many Metrics
More data does not equal better insights. If you cannot explain why a metric matters to the business, drop it from your report.
Ignoring Seasonality
Always compare year-over-year, not just month-over-month. December traffic dips are holiday patterns, not SEO failures.
Reporting Without Context
“Traffic dropped 10%” means nothing alone. Add context: algorithm updates, competitive shifts, or technical issues that explain the change.
Vanity Metric Obsession
Domain Authority is not a Google metric. Track actual rankings and traffic instead of third-party scores that do not influence search results.
Forgetting Attribution Windows
SEO influence does not end at first click. Users may find you via search, leave, and convert later through another channel. Use proper attribution models.
FAQ
How often should I report SEO KPIs?
Weekly: Quick health check (traffic, major ranking changes)
Monthly: Full KPI report with insights and actions
Quarterly: Strategic review with ROI analysis
What’s a good organic CTR?
It depends on position. If you rank #1, aim for 25%+. Position #3-5 should see 8-12%. Below position 10, anything above 2% is decent.
How do I track keyword rankings for free?
Google Search Console shows average position for queries. For specific keyword tracking, use the free tier of tools like Ubersuggest (limited) or manually check in incognito mode.
Should I track Domain Authority?
No. DA is a Moz metric, not a Google metric. It’s useful for quick competitor comparisons but shouldn’t be a KPI. Track actual rankings and traffic instead.
Start Tracking What Matters
The best SEO practitioners don’t track everything—they track the right things.
Start with these 12 KPIs, build a simple report using the Metric → Insight → Action format, and focus on connecting your SEO work to business outcomes.
Your next step: Set up a basic Looker Studio dashboard connecting GA4 and Search Console. Even a simple dashboard beats a scattered spreadsheet.
Related reading: