TL;DR — Key Takeaways:
• A/B testing compares two versions to find what performs better — statistically, not by gut feel
• You need ~1,000 conversions per variation for reliable results (more for small effect sizes)
• Run tests for full weeks to capture day-of-week patterns, minimum 1-2 weeks
• Test one element at a time unless running a multivariate test
• 70-80% of tests fail — that’s normal and still valuable information
What A/B Testing Actually Is
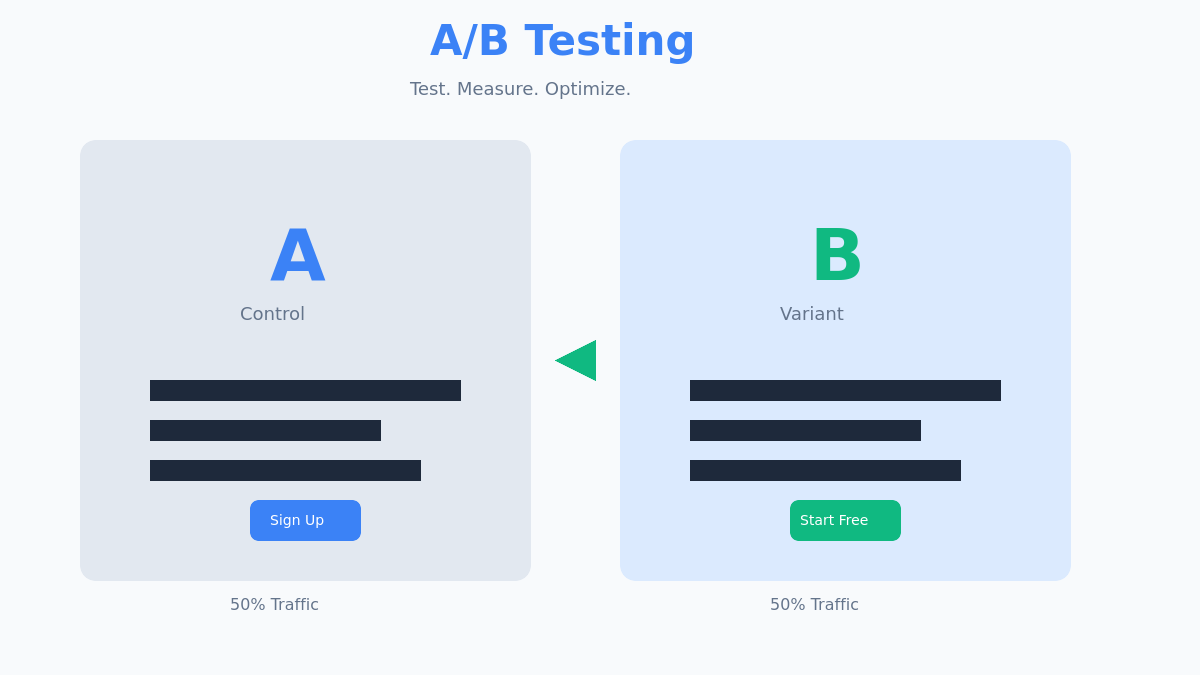
A/B testing (also called split testing) is a method of comparing two versions of a page, element, or experience to determine which performs better.
You split your traffic: 50% sees version A (control), 50% sees version B (variant). After enough data, statistics tell you which version wins.
The key word is statistics. A/B testing removes guesswork. You’re not picking the design you like better or what the CEO prefers — you’re measuring what actually works.
Here’s a real example from my work: a client was convinced their long-form landing page was hurting conversions. “It’s too much text,” they said. We tested a shorter version. Result? The long-form page converted 31% better. Gut feeling was wrong; data was right.
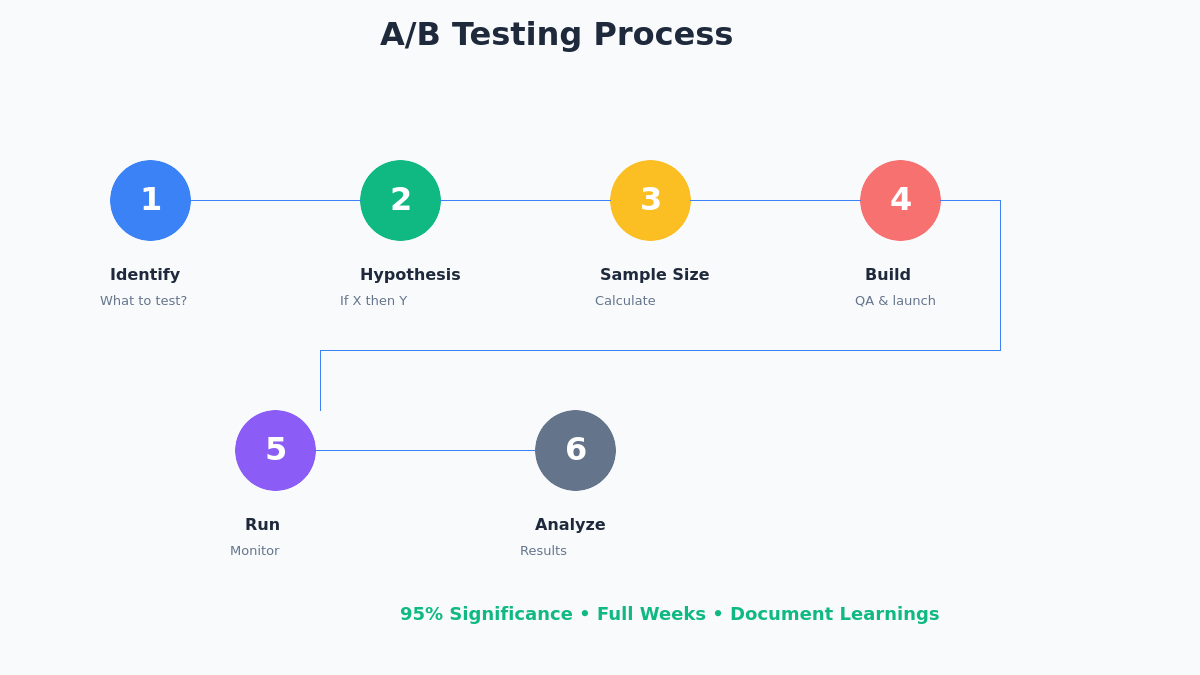
The A/B Testing Process
Step 1: Identify What to Test
Start with data, not opinions. Look at:
- Analytics: Where do users drop off? Which pages have high bounce rates?
- Heatmaps: Where do users click? What do they ignore?
- User feedback: What do customers complain about?
- Funnel analysis: Which step loses the most users?
Prioritize tests by potential impact. A 10% improvement on a page with 100,000 visitors matters more than a 50% improvement on a page with 1,000 visitors.
Step 2: Form a Hypothesis
Don’t just “test a new button color.” Frame it as a hypothesis:
Format: “If we [change X], then [metric Y] will improve because [reason Z].”
Examples:
- “If we add trust badges near the checkout button, conversion rate will improve because users expressed security concerns in surveys.”
- “If we shorten the form from 8 fields to 5, form completions will increase because analytics shows 40% drop-off after field 5.”
The hypothesis forces you to be specific about what you’re testing, what you expect, and why.
Step 3: Calculate Sample Size
This is where most tests fail before they start. You need enough data for statistical significance.
Use a sample size calculator. Key inputs:
- Baseline conversion rate: Your current conversion rate
- Minimum detectable effect (MDE): The smallest improvement worth detecting
- Statistical significance: Usually 95%
- Statistical power: Usually 80%
Example calculation:
| Scenario | Required Sample (per variation) |
|---|---|
| 5% baseline, detect 10% relative lift | ~31,000 visitors |
| 5% baseline, detect 20% relative lift | ~8,000 visitors |
| 2% baseline, detect 20% relative lift | ~20,000 visitors |
| 10% baseline, detect 10% relative lift | ~15,000 visitors |
If you don’t have enough traffic for your desired MDE, either:
1. Accept a larger MDE (only detect bigger wins)
2. Run the test longer
3. Test on a higher-traffic page
Step 4: Build and Launch
Use a proper A/B testing tool — not manual redirects or messy JavaScript.
Popular tools:
| Tool | Best For | Price |
|---|---|---|
| Google Optimize | Beginners (discontinued, use alternatives) | Free (was) |
| VWO | Visual editor, SMBs | From $200/mo |
| Optimizely | Enterprise | Custom pricing |
| AB Tasty | Mid-market | From $400/mo |
| Convert | Privacy-focused | From $99/mo |
QA before launch:
- Test on multiple browsers (Chrome, Safari, Firefox, Edge)
- Test on mobile and desktop
- Verify tracking is firing correctly for both variations
- Check for visual glitches (elements jumping, flash of original content)
Step 5: Run and Monitor
How long to run:
- Minimum: 1-2 full weeks (to capture weekday/weekend patterns)
- Until you hit your calculated sample size
- Until the test reaches statistical significance
Don’t peek and stop early. This is the biggest mistake in A/B testing. If you stop the test when it first shows significance, you’re likely seeing a false positive. Commit to your sample size before starting.
Monitor for:
- Broken experiences (variant not loading, tracking errors)
- Major external events that could skew results
- Traffic distribution is actually 50/50
Step 6: Analyze Results
Once the test completes, analyze:
Primary metric: Did the variant beat the control with statistical significance?
Secondary metrics: What else changed? Sometimes a variant increases clicks but decreases actual purchases.
Segmentation: Did the variant perform differently for:
- Mobile vs desktop users?
- New vs returning visitors?
- Different traffic sources?
What’s a “win”?
| Result | Action |
|---|---|
| Variant wins (95%+ significance) | Implement the change |
| Control wins | Keep the original, log the learning |
| No significant difference | Either version works; test something bigger |
What to Test: High-Impact Elements
Not all tests are equal. Focus on elements that directly impact conversions.
Headlines and Copy
Headlines are the first thing users read. Test:
- Benefit-focused vs feature-focused
- Short vs long
- Question vs statement
- With numbers vs without
Example test:
A: “Project Management Software”
B: “Finish Projects 2x Faster”
Result: B won by 24%
Call-to-Action (CTA)
The button where conversion happens. Test:
- Button text (“Get Started” vs “Start Free Trial” vs “See Pricing”)
- Button color (only if it affects contrast/visibility)
- Button size and placement
- Single CTA vs multiple CTAs
Myth: “Red buttons convert better.” Reality: There’s no universal best color. Test what creates contrast on YOUR page.
Forms
Every additional field reduces completions. Test:
- Number of fields (less is usually better)
- Required vs optional fields
- Single-page vs multi-step forms
- Field labels and placeholder text
In my experience: Removing the phone number field from a B2B lead form typically increases submissions by 20-40%. You can always ask for phone later in the sales process.
Social Proof
Trust signals can significantly impact conversions. Test:
- Customer logos vs testimonials vs reviews
- Placement of trust badges
- Specific numbers (“10,000+ customers” vs “Thousands of customers”)
- Photo testimonials vs text-only
Page Layout
Bigger structural changes:
- Long-form vs short-form pages
- Navigation visible vs hidden
- Above-the-fold content
- Image vs video hero
Understanding Statistical Significance
Statistical significance measures confidence that your result isn’t due to chance.
A 95% significance level means: if there was truly no difference between versions, you’d see this result (or more extreme) only 5% of the time by random chance.
Key concepts:
- p-value: Probability the result is due to chance. p < 0.05 means 95% significance.
- Confidence interval: Range where the true effect likely falls. “5-15% lift” is more useful than “10% lift.”
- Statistical power: Probability of detecting a real effect if it exists. 80% is standard.
Warning: 95% significance doesn’t mean 95% chance the variant is better. It means, assuming no real difference, you’d see this result 5% of the time. That’s why multiple tests will produce some false positives. For a deeper dive into statistical pitfalls, check this guide to statistical significance in A/B testing from CXL.
Common A/B Testing Mistakes
1. Stopping too early
You see 98% significance on day 3 and call the winner. But early results fluctuate wildly. Commit to your sample size.
2. Testing too many things at once
You change the headline, CTA, image, and layout. The variant wins. What caused it? You don’t know. Test one element at a time (unless doing multivariate testing).
3. Ignoring sample size
“We ran the test for a week.” Time doesn’t matter — sample size does. A week with 500 visitors isn’t enough for most tests.
4. Testing low-impact elements
Button color on a page that gets 100 visitors/month. Even a 50% lift barely moves the needle. Focus on high-traffic, high-impact areas.
5. Not documenting learnings
A failed test is still valuable data. Keep a test log with hypotheses, results, and learnings. Patterns emerge over time.
6. Testing without a goal
“Let’s just test something.” Without a clear hypothesis and success metric, you’re just generating noise.
The Nielsen Norman Group has excellent research on combining A/B testing with usability studies to avoid these common pitfalls.
A/B Testing vs Multivariate Testing
| Feature | A/B Testing | Multivariate Testing |
|---|---|---|
| What it tests | One element at a time | Multiple elements simultaneously |
| Variations | 2 (A vs B) | Many (all combinations) |
| Traffic needed | Lower | Much higher |
| Insights | Which version wins | Which combination wins + element interactions |
| Best for | Most situations | High-traffic pages, complex optimization |
Example: Testing 3 headlines × 3 CTAs × 2 images = 18 combinations. You need enough traffic for 18 variations to reach significance. Most sites should stick with A/B testing.
FAQ
How long should I run an A/B test?
Until you reach your calculated sample size AND at least 1-2 full weeks (to capture weekly patterns). Time alone isn’t the answer — sample size is.
What’s a good conversion rate improvement?
It depends on your baseline. A 20% relative improvement (e.g., 5% → 6%) is solid. But remember: 70-80% of tests show no significant winner. That’s normal.
Can I run multiple A/B tests at once?
Yes, but on different pages or different user segments. Running multiple tests on the same page can create interaction effects that skew results.
What if my test shows no significant result?
That’s still valuable. It means the change didn’t matter. Pick whichever version is easier to maintain and test something with bigger potential impact.
Start Testing Today
A/B testing is the most reliable way to improve conversion rates. But it requires discipline: form hypotheses, calculate sample sizes, commit to the test duration, and document everything.
Most tests fail. That’s not a problem — it’s how you learn what actually moves the needle for your specific audience.
Your next step: Identify your highest-traffic, lowest-converting page. Form one hypothesis about why it underperforms. Run your first (or next) test.
Related reading: